ChartScale

1. What and Why
2. Installation
A. Where to get this plugin
The github repository is:
ChartScale-pi for Windows can be downloaded from this location:
[https://github.com/rgleason/chartscale_pi/releases|Chartscale
Executable]]
Click on the most recent to download.
B. How to install this plugin
Double-click the downloaded file (with “chartscale_pi” in the name and
“.exe” as extension) and follow the set-up instructions.
That’s it.
Open (or restart) OpenCPN.
Click Tools-Options-Plugins
Scroll down untill you see the ChartScale-pi.
limage::chartscale_enable.png[ ]
]
Click “Enable” to enable the plugin and then “Preferences” to set your preferences (should be self-explanatory).
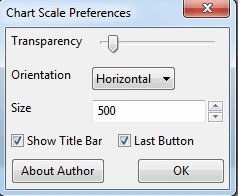
Click “OK” in the Chart Scale Preferences window and then “OK” in
the Plugins-window.
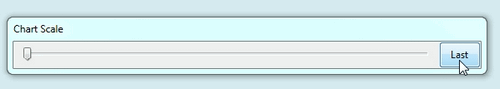
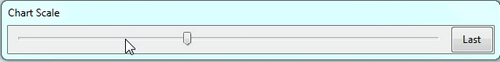
Now the Chart Scale slider should appear on your screen.
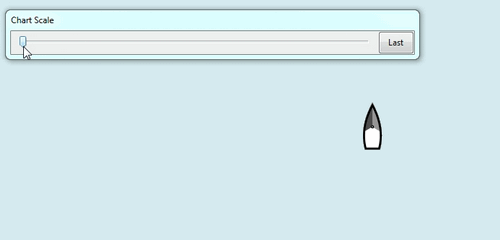
In this example the slider-button is to the far left. That means “zoom in as far as possible”.
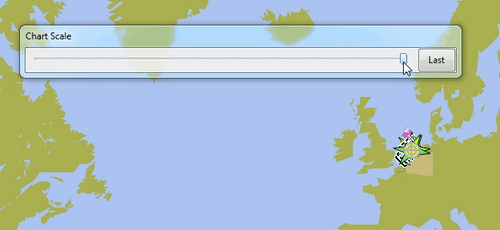
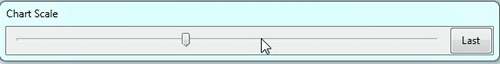
And in this example the slider-button is to the far right. That means “zoom out as far as possible”.
3. Standard Actions
What are basic (standard) actions you have to do to make ChartScale-pi work.
Well, that is quite simple. Click on the slider-bar. Click left of the slider-button to zoom in…
And click right of the slider-button to zoom out.
Click “Last” to zoom back to the zoom-factor that was last used.