Climatology
Links
CL-DATA separated by type is located in Sourceforge This 30 years of NOAA Data is included with the plugin.
Climatology Plugin
Intended to aid in planning sailing voyages, to help visualize weather patterns, and to integrate with weather routing plugin to compute optimal sailing routes. Weather_routing plugin will use Climatology to make long voyaging routes. This plugin goes well beyond what a Pilot chart provides.
Manage and view monthly gridded Climate data compiled from various sources. Satellite weather data from the last 30 years is averaged, then represented using only useful bits, then compressed to produce a much smaller database used by the plugin.
Climatology provides monthly data for Wind, Currents, Sea Level Pressure, Sea Temperature, Air Temperature, Cloud Cover, Precipitation, Relative Humidity, Lightning, Sea Depth, and Cyclones.
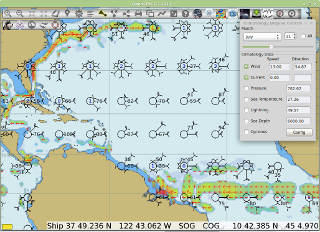
July Wind with Current overlay. (Click for enlarged view)
How do I set the Wind and Wind Rose settings to work right?
See FAQ below.
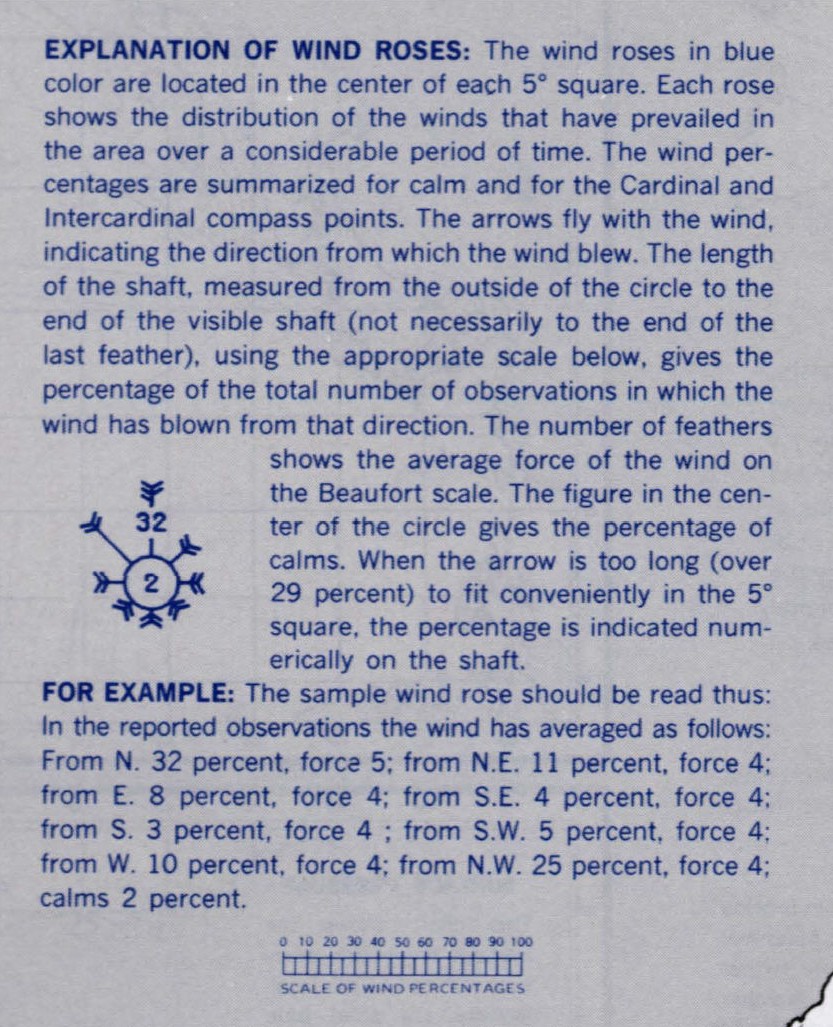
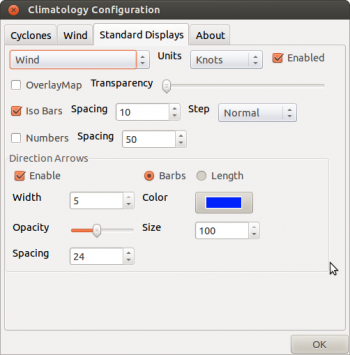
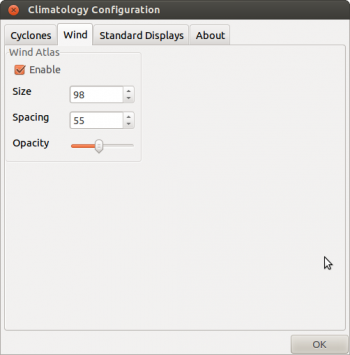
The wind atlas time shows the percentage of time the wind is in each of eight directions as a length of the arrow or in the case it is over 29% of the time a number is shown. The barbs indicate wind speed, each barb being 5 knots. The numbers inside the circle, if blue give the percentage of average speed as calm (3 knots or less) or in red at least gale force (above 34 knots and above).
Weather_routing plugin uses Climatology Data
Weather_routing_pi can utilize the 30 year wind averages and current date from Climatology_pi. This is a unique and useful application. For more information see Weather_routing_pi.
Climatology Data types
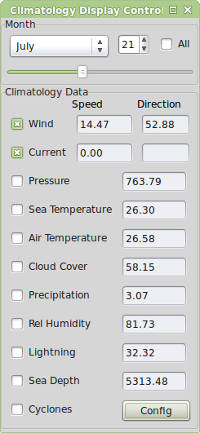
Climatology Data Types with Display Options
Climatology has a number of Data Types. The display characteristics of
each data type are controlled from the “Config” menu which first
requires selection of the particular data type from a dropbox. Amoungst
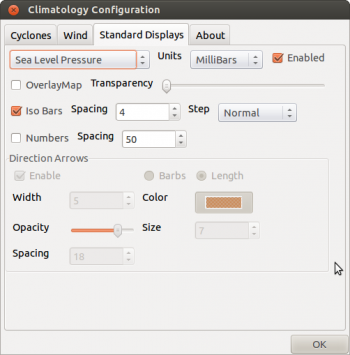
the display controls for each datatype are Enable/Disable, and to show the data as a “Overlay” which requires that OpenGL be enabled under Option > Display > Advanced. The display options have been configured already for general use provided OpenGL is checked and should require no special configuration effort to be useful, however as users become familiar with the plugin, they may wish to change a setting for their type of use (such as if they do not have OpenGL checked.)
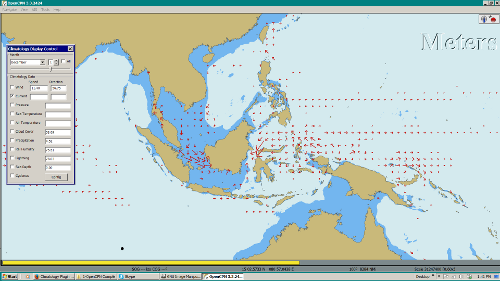
The table below shows four data types that are normally shown in vector format and do not require that Overlay be checked, the other data types can also be configured to not require that Overlay be checked if OpenGL is not operational. Click for an englarged view.
Normal Vector Data Types
(Opengl not required) - Malaysia
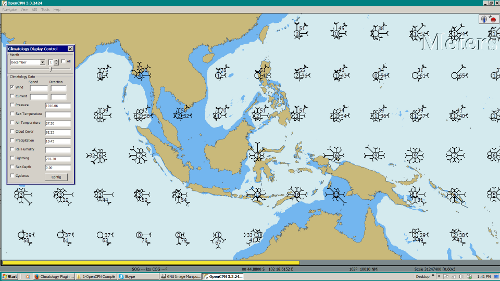
Wind - December
Current - December
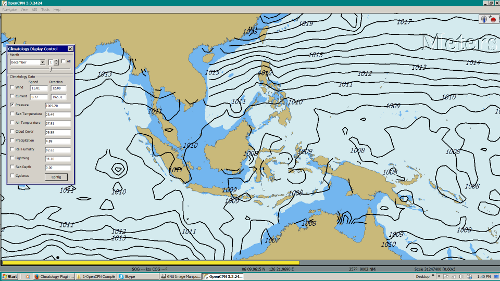
Pressure - December
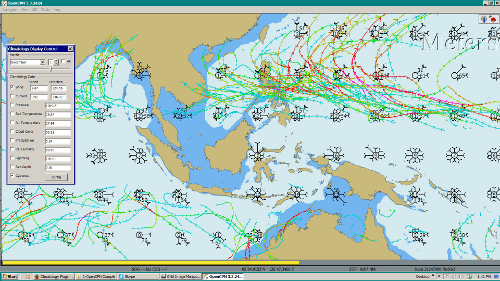
Cyclones - December
The table below shows data types which are normally shown with Overlay checked and OpenGL turned on, however they can be configured to show vector data when Opengl is off, by unchecking “Overlay” for each data type and configuring a few of the display settings. Click for enlarged view.
Normal Overlay Data Types
(requires Opengl) - Atlantic
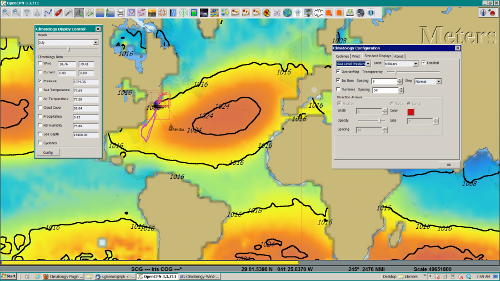
Pressure
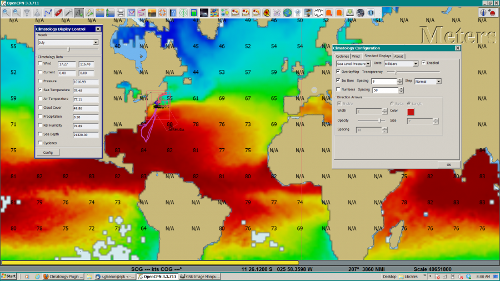
Sea Temperature - July
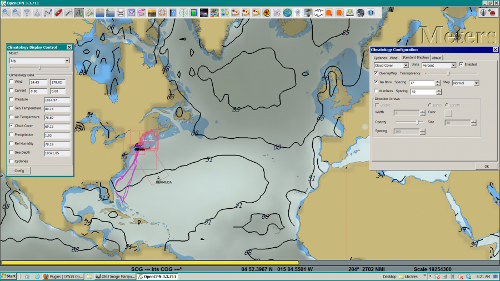
Cloud Cover
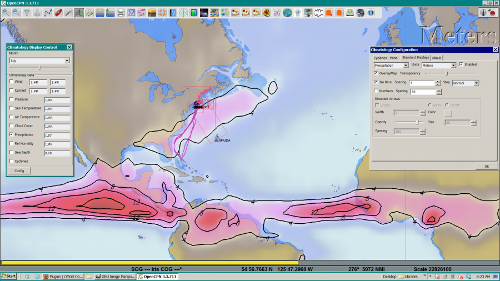
Precipitation
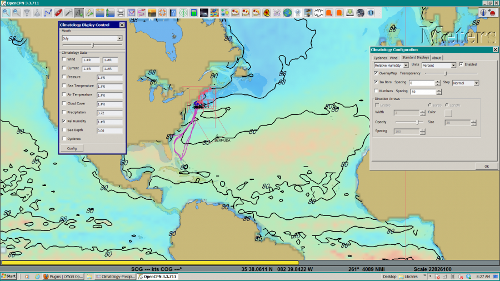
Relative Humidity
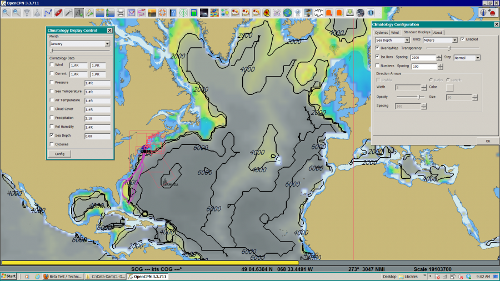
Sea Depth
Note: The Data-Types in the table above can be configured by the user to show data if Opengl is not turned on by selecting “Config”, selecting the appropriate data type from the Drop Down window, and unchecking “Overlay” and then selecting “Numbers”.
Configuration
Config > Standard Tab > Wind dropdown
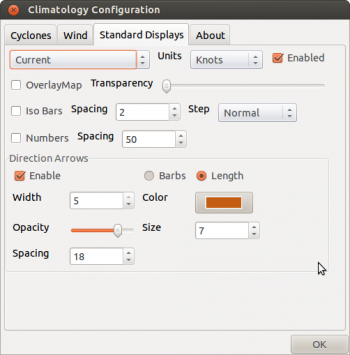
Config > Standard Tab > Current dropdown
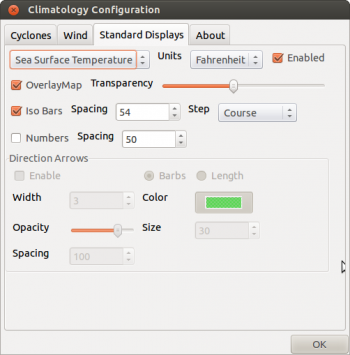
Config > Standard Tab > SeaSurfaceTemperature dropdown
Config > Standard Tab > SeaLevelPressure dropdown
Config > Wind Tab
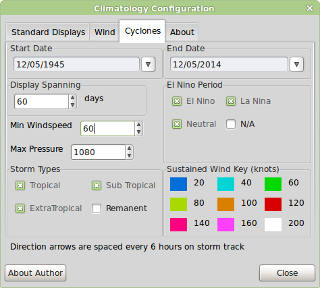
Config > Cyclones Tab
Installation of the Plugin
The plugin works with OpenCPN 3.2 and newer and is available for
download from opencpn.org/ocpn/downloadplugins.
-
Windows: Download and run installer
-
Linux: dpkg -i <package_name>.deb or rpm -i <package_name>.rpm or cd /usr; sudo tar xavf <package_name>
You must also get the data files, the plugin will inform you where to install them.
FAQ
How do I set the Wind Rose settings so that they work right? Set the two settings somewhere around Size:100 and Spacing:100 or Size:125 and Spacing:60.

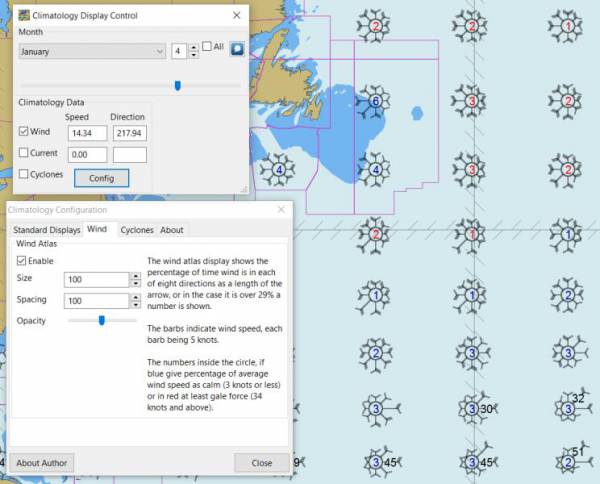
Wind set at Size:100 and Spacing:100

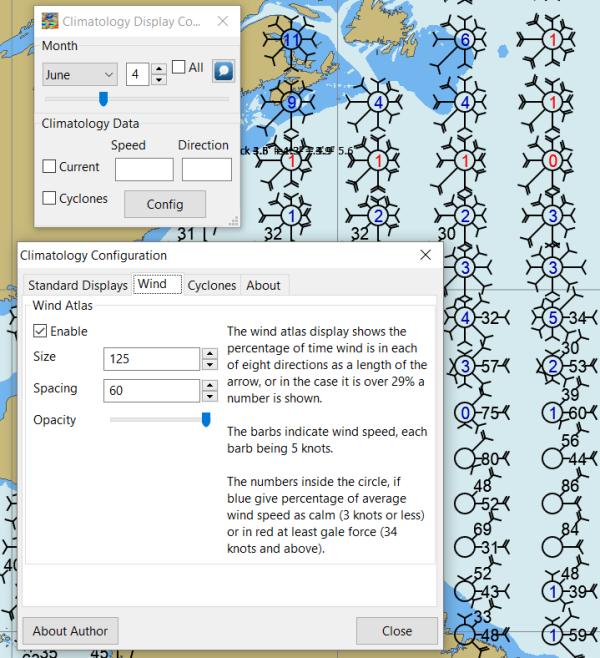
Wind set at Size:125 and Spacing:60 (Size:140 and Spacing:100 also might work)
Also Enable in the Wind Tab.
Warning about use of Data:
Weather_routing is only as good as the data provided by the Grib plugin and the Climatology plugin.
-
Climatology plugin: Depends on a separate set of files that must be downloaded, extracted and placed in the proper directory. Climatology data is generally averaged since the 1980’s depending on data type and sources available (for example, Wind data is averaged 6 hr data since 1987). The entire source data set is over 180 gb, however after averaging and compression it becomes about 7mb. There are various macro factors which affect weather over a given season which should be considered, including El Nino, Gulf stream, etc. Climatology has averaged these effects.
-
These planning tools may be helpful, but should be taken with a healthy “grain of salt” as any good sailor (who looks out to the horizon) should know. -Rick Gleason
About the Author
The Climatology Plugin was written by Sean Depagnier who has written many Opencpn plugins. There is a strong likelihood you have already used one of his plugins. The plugin is over 1000 lines of code written with care and skill. Sean has a voyage fund and would appreciate any contribution large or small, please see the Donate button under the Configuration > About Tab. -Thank you Sean for this excellent plugin!