WMM
The World Magnetic Model PlugIn for OpenCPN implements and bundles the the current NOAA World Magnetic Model, WMM2015, valid until 2020. The WMM plugin is an Internal Plugin, always distributed with OpenCPN, no separate download is required.
Old stone walls record history of Earth’s magnetic wanderings. Very interesting article, showing a good use for lidar. This shows why the World Magnetic Model plugin (WMM_pi) needs to be updated on a regular basis..
Links
Source: Opencpn
Internal Plugin
Forum:
World
Magnetic Model Plugin (WMM) Thread
Forum: WMM
Thread
A Quick-Start Guide.
This plugin is all about the value of the magnetic variation. The value at your boat position, at the position of the cursor, and the rest of the world.
Download and install the plugin. Go to Options–>Plugins. Press the “Enable” button.
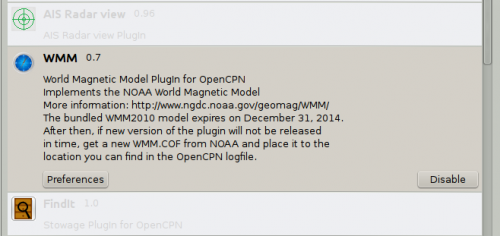
Then press the Preference button, and copy the settings below.
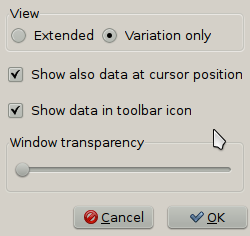
Press OK twice. The WMM icon will now be found in your ToolBar. The numbers in the button is the variation at your position.

Press the Toolbar Button and the small dialog below will appear on the screen. The first value is the same as in the button, the variation at your boat (gps) position. The second value is the variation at the position of the cursor.
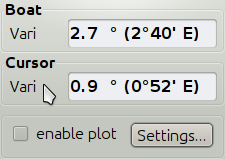
That is all you need to know to get started, and for most of your daily use. Need more details? Read on!
The Details
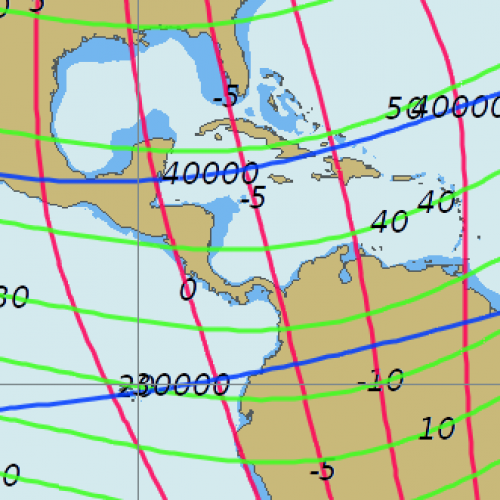
World Magnetic Model Plotting allows users to cross reference the magnetic deviation values printed on many raster charts.
Variation is the angle between true and magnetic north.
Inclination is the vertical angle of the magnetic field.
A compass is adjusted for the inclination in the intended sales region.
If you buy a compass in Europe; it will not be level in Australia, for
example.
Field Strength is the magnetic field in nano tesla from 20000 to
66000.
Currently the total field strength is shown, with no immediate practical
use. Hopefully this will change to show the horizontal component in the
future, that has an impact on whether the compass works or not, near the
magnetical poles.
The plotted lines are similar to a topographic map. The space between them can be adjusted; more space takes less time to calculate.
The Step size and Pole accuracy sliders allow a trade off for speed vs computation time.
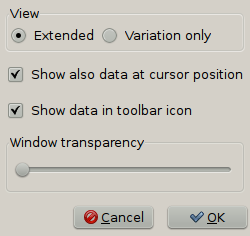
With the extended Radio-button, this dialog will show on the screen

F - Total Intensity of the geomagnetic field
H - Horizontal Intensity of the geomagnetic field
X - North Component of the geomagnetic field
Y - East Component of the geomagnetic field
Z - Vertical Component of the geomagnetic field
I (DIP) - Geomagnetic Inclination
D (DEC) - Geomagnetic Declination (Magnetic Variation)
Click “Settings” and adjust the display of the graphical plot.
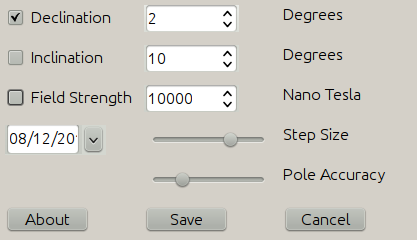
Show variation only.
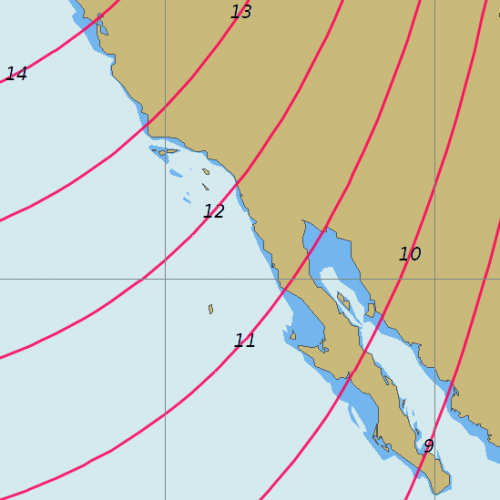
Or all options together.
